Documentation

In App Settings

In App Settings


InTheZone, TrainingPower and TrainingHR all support In App Settings, which is a way to update app settings directly on the device without using Garmin Express or a Phone. Not all devices support this feature - it depends on Garmin's rollout of firmware. However, if your device does support it, you can access it with the following steps:
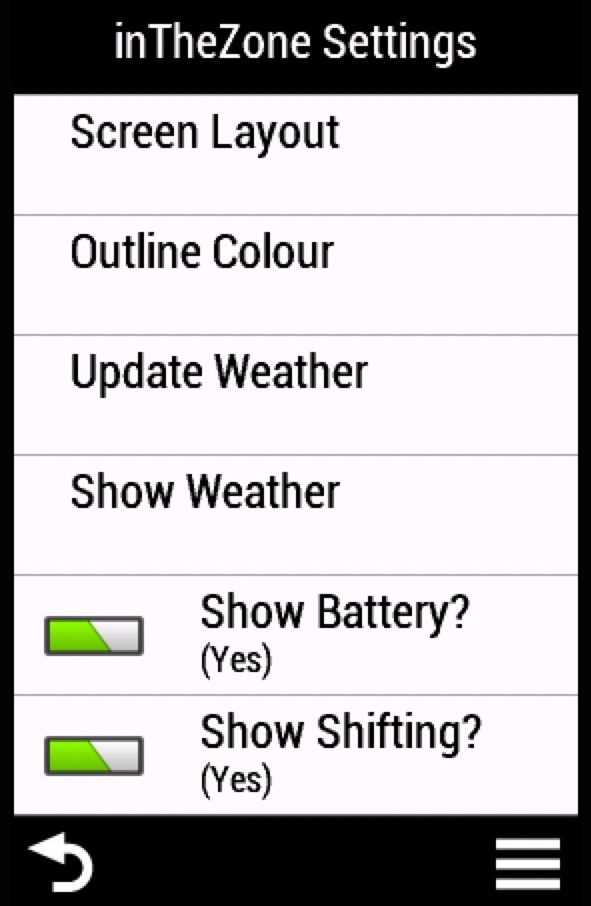
 

In The Zone (Edge1030) - In App Settings


Accessing Edge Device Settings

  1. With one of the Apps (InTheZone, TrainingPower or TrainingHR) displayed on the screen, press the top-right button.
  2. In the menu of options that appears, scroll down till you see "Data Fields".
  3. Press the top-right button on your device, or touch the "Data Fields" menu option on a touch screen device.
  4. Scroll down to "Connect IQ Datafields" and choose the App you want to edit settings for.
  5. NOTE:  Don't hold down the back button on your device to exit settings as it can cause the App to crash. Instead, single press the back button to exit the App settings and then you may hold down the Back button to return to the main screen.


Accessing Watch Device Settings

  1. With one of the Apps (InTheZone, TrainingPower or TrainingHR) displayed on the screen, Long press the Menu (scroll-up) button.
  2. In the menu of options that appears, scroll down till you see "ConnectIQ Fields" then select it.
  3. Choose the App you want to edit settings for.
Power Zones

Power Zones


Use the following table to experiment with Coggan FTP based Power Zones. Update your FTP and Weight in the two fields at the top of the table and then click the Calculate button. You can also change each Power Zone start and End percentages and see the impact.


Power Zone Zone Zone Start% Zone End% Watts Start Watts End W/Kg Start W/Kg End
Recovery Z1 % % 0 0 0 0
Endurance Z2 % % 0 0 0 0
Tempo Z3 % % 0 0 0 0
Threshold Z4 % % 0 0 0 0
Sweet Spot Sweet Spot % % 0 0 0 0
Vo2Max Z5 % % 0 0 0 0
Anaerobic Z6 % % 0 0 0 0
Neuromuscular Z7 % MAX% 0 0 0 0


Z2 - Z7 are configurable in the App (MAX is continuously calculated during an Activity). The app displays the percentage your power is within the respective zone.

Heart Rate Zones

Heart Rate Zones


Use the following table to experiment with Coggan Heart Rate Zones. Update your source HR (LTHR, MAXHR, HRR), below then click the Calculate button. You can also change each Heart Rate Zone start and End percentages and see the impact.


LTHR = Lactate Threshold Heart Rate; MAXHR = Maximum Heart Rate; HRR = Heart Rate Reserve (based on Resting HR).


Heart Rate Zone Zone Zone Start% Zone End% HR Start HR End
Recovery Z1 % % 0 0
Endurance Z2 % % 0 0
Tempo Z3 % % 0 0
Threshold Z4 % % 0 0
Vo2Max Z5 % MAX% 0 0


Z2 - Z5 are configurable in the App (MAX is continuously calculated during an Activity). The app displays the percentage your HR is within the respective zone.

Average Power

Average Power (and Power Moving Average)


There are three Average Power calculations available:


If you are using SWA or NP for your power average, you really should have auto-pause configured off on your device so that any resting/coasting during an activity is accuratley reflected on your device. Of course, there is an App setting that allows you to ignore zero power when your device is auto-paused, but you wouldn't use this for proper training, right?...


NOTE: If NP is chosen you may also choose to display Intensity Factor (IF) and Training Stress Score (TSS). Normalized Power, Intensity Factor and Training Stress Score Explained


1-30 Second Power Moving Average (MA)


Another configuration option for TrainingPower and InTheZone is the ability to display the Power Output as a 1-30 second Moving Average (a 3-second MA is the default). This is a very different option to the Average Power calculations described, above.

A Moving Average is by definition an average of values in a moving Window. For example, if we use a 3-second MA, then an average is calculated every second, of the previous 3 seconds worth of Power values. This 3-second window is continuously moving throughout your activity.

Typically, a 3-second Moving Average for Power is recommended as it provides adequate smoothing of the "noisy" power meter readings, whilst still retaining good reactivity. You will see the option to use a 3-second Moving Average on a lot of training platforms, like Zwift and TrainerRoad, etc.

NOTES:

  1. As the Moving Average is an Average calculation, your instantaneous power output and the calculated Moving Average will almost certainly never equal each other. One will be higher than the other. If your power output is increasing, the MA will be less. If your power output is decreasing the MA will be higher. The benefit of this, as I already mentioned, is in smoothing out the "noisy" power meter readings.
  2. If you don't want to use a Moving Average, you can set the "Power Moving Average Interval" to "1 Second" in the App Settings (InTheZone and TrainingPower). This will prevent any MA calculations and will just present the current Instantaneous power output.

Watt Prime

Watt Prime


In The Zone - Watt Prime Display


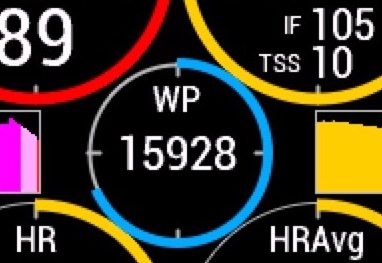
Watt Prime (W') Balance is an estimation of the amount of critical energy you have remaining above FTP.

An App setting lets you choose between the W Prime Balance DIFFERENTIAL calculation (Froncioni and Clarke, which recovers faster when power dips below threshold) or the INTEGRAL calculation (Skiba, et al.). Either setting requires 2 settings - Functional Threshold Power (FTP) and W Prime (in Joules). If your W' Balance goes negative (a breakthrough occurred) the app will automatically adjust your W PRIME and record it in App Settings.


  • The Watt Prime circle will display in Blue for values 50-100%, Orange for values 20-50% and Red for values less than 20%.
  • For a Breakthrough (W Prime less than zero) it will be the colour Purple .
  • Set W Prime to zero in App Settings if not required.


Understanding Work Above Threshold - Dr. Philip Friere Skiba

Watt Prime Decay

Watt Prime Decay


Just as your fitness fades over time when you haven't been exercising, so too does your W Prime.


The app can track when you last did an activity and automatically decay your W Prime setting by a daily percentage. You can set a decay of between 0.1% and 2.5% (between 1 and 25 in App Settings).

For example, if my WPrime is 20,000 and I set a decay of 5 (equating to 0.5%), then each day of inactivity, my W Prime will decay by 0.5% (in this case, 100J) of the current value. It checks the last activity date and calculates the the new WPrime each time the App starts. If you don't want your W Prime to automatically decay, set the decay to zero in App Settings (this is the default setting).

Battery Status Indicator

Battery Status Indicator


The Battery level of the device is checked every 20 minutes and then every 5 mins once the level is below 10%


InTheZone & TrainingPower - Battery Status Indicator


  • Green 75-100%
  • Blue 50-75%
  • Orange 20-50%
  • Red less than 20%


How much battery power does TrainingPower, TrainingHR and InTheZone consume?


Connect IQ apps are not written in the native language of a Garmin device. They are built, compiled and run as "byte-code" within a Virtual Machine running on your device. As such, Connect IQ devices tend to use more processing power, which leads to the consumption of more battery power.

All of my Apps were built with a primary focus on reducing processing and therefore, power consumption. However, some key aspects of the Apps do require considerable calculation and processing power to present all the features. In practice, battery consumption also depends on a lot of external factors, such as prevailing temperature, existing charge state, battery and device age. If you find the Apps to be consuming more battery than you might have expected, you can try the following steps (in order listed) to reduce the processing and therefore battery power required to run the App:

  1. Turn off display of the Histograms (both Power and HR). In The Zone: Set Histograms to "No Histograms". TrainingHR: Set "Display HR Histogram?" to "No".
  2. Turn off Weather display (only applicable to In The Zone). This is achieved by setting "Show Weather" and "Update Weather" both to "NEVER".
  3. Turn off W Prime calculation. In App Settings (In The Zone and Training Power) set the W Prime (J) setting to "0".
  4. Set your Average Power to "Standard Average" (In The Zone and TrainingPower).
  5. Set your Power Averaging (1-30 seconds) to be 1 second, in App Settings (In The Zone and TrainingPower).
  6. Turn off gear shifting calculation (In The Zone).
Weather

Weather Information


Apps Displaying Weather Details (currently only InTheZone)


NOTE:  Unless you have Show Weather set to "Always", the weather will not begin to display until the Activity timer has started. Also note, if Show Weather is set to anything other than "Never" or "Always" AND you have Update Weather set to "On LAP Press" then Weather will not be displayed until you press the LAP button.


Wind Direction:


The App will display the current Wind Speed (in km/h or miles/hr depending on your Garmin Profile) and diection by showing a compass arrow indicating the direction the Wind is blowing from.

Compass Point Wind Direction Icon Displayed
North (N) Wind blowing from the North
c
North East (NE) Wind blowing from the North East
g
East (E) Wind blowing from the East
a
South East (SE) Wind blowing from the South East
h
South (S) Wind blowing from the South
d
South West (SW) Wind blowing from the South West
f
West (W) Wind blowing from the West
b
North West (NW) Wind blowing from the North West
e


Garmin Weather Conditions:


The App will calculate the current Sunrise and Sunset time based on your current GPS location to determine whether to display Day Time or Night Time icons.


Garmin ID Weather Condition Day Time Icon Night Time Icon
0 Clear
1 Partly cloudy
2 Mostly cloudy
3 Rain
4 Snow
5 Windy
6 Thunderstorms
7 Wintry mix
8 Fog
9 Hazy
10 Hail
11 Scattered showers
12 Scattered thunderstorms
13 Unknown precipitation
14 Light rain
15 Heavy rain
16 Light snow
17 Heavy snow
18 Light rain snow
19 Heavy rain snow
20 Cloudy
21 Rain snow
22 Partly clear
23 Mostly clear
24 Light showers
25 Showers
26 Heavy showers
27 Chance of showers
28 Chance of thunderstorms
29 Mist
30 Dust
31 Drizzle
32 Tornado
33 Smoke
34 Ice
35 Sand
36 Squall
37 Sandstorm
38 Volcanic ash
39 Haze
40 Fair
41 Hurricane
42 Tropical storm
43 Chance of snow
44 Chance of rain snow
45 Cloudy chance of rain
46 Cloudy chance of snow
47 Cloudy chance of rain snow
48 Flurries
49 Freezing rain
50 Sleet
51 Ice snow
52 Thin clouds
53 Unknown